
Daily Market Analysis and Forex News
Trump delays tariff deadline…what next?

Trump extends tariff pause from July 9th to August 1st
Markets stabilize on trade deal hopes
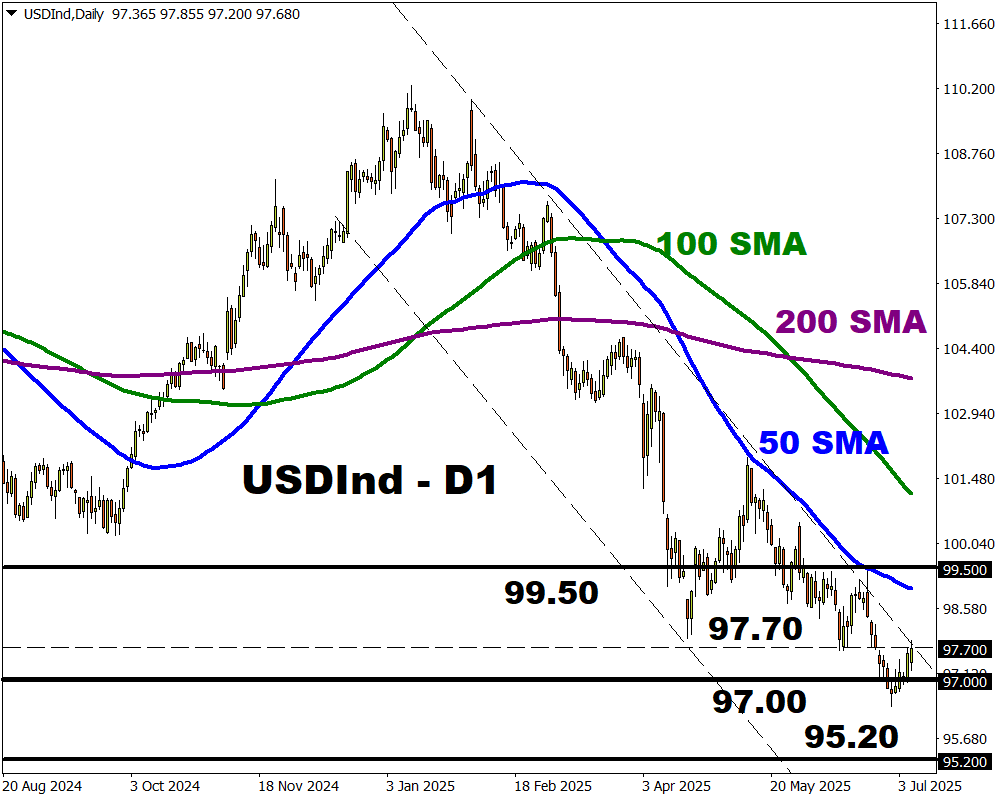
USDInd forecasted to move ↑ 0.3% or ↓ 0.2% post Fed
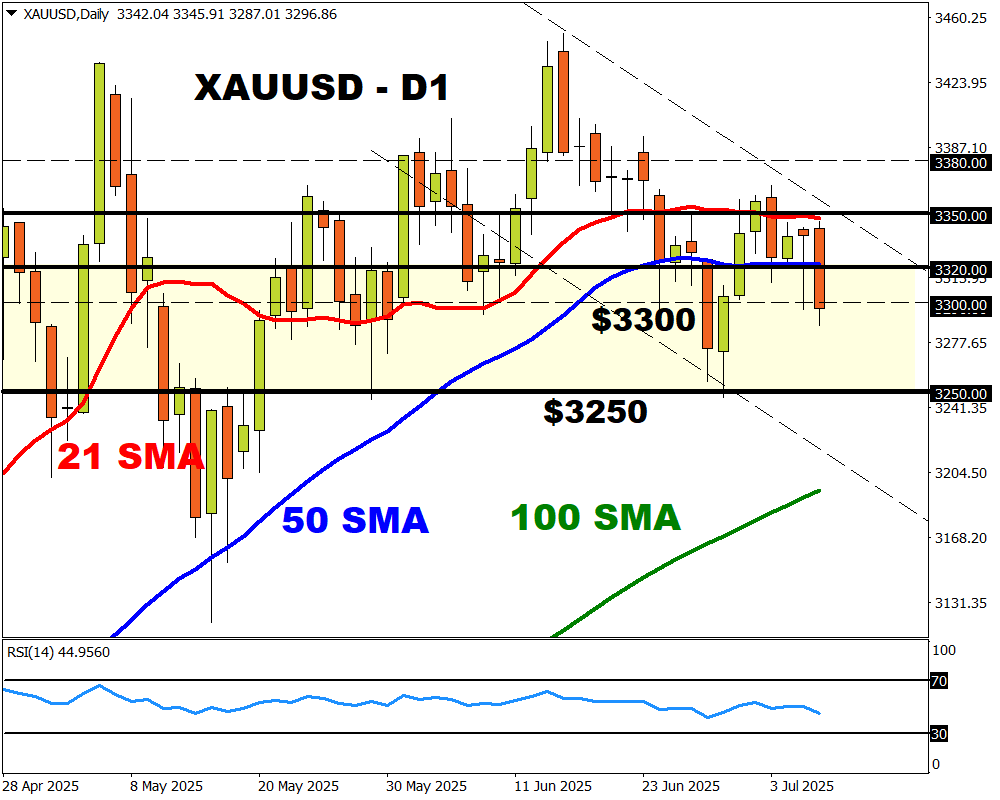
XAUUSD ↓ over 1% ahead of Fed minutes
Some stability returned to markets on Tuesday after Trump kicked the tariff can down the road to August 1st.
US equities opened mixed after the S&P 500 ended almost 1% lower in the previous session. Gold prices tumbled roughly 1.3% while FXTM’s USDInd punched above 97.70.
Investors were initially shaken by Trump’s aggressive stance after signing letters dictating new tariff rates in 14 countries.
However, there seems to be some cautious optimism surrounding the extension, which would provide more time for trade deals. Nevertheless, it does not change the fact that the US government has only secured 3 trade deals – well below what was pledged on “Liberation Day” back in April.
So, the question is whether this extra time will force US trading partners to cut deals quickly. If not, markets could be headed for “Liberation Day 2.0” as time runs out.
Fed meeting minutes could move USD
Beyond Trump’s tariff saga, investors may keep an eye on the Fed meeting minutes on Wednesday evening.
The minutes of the June 17-18 meeting may reflect a divided committee juggling with inflation risks and growth concerns. Traders are currently pricing in a 72% probability of a 25-basis point cut by September.
A solid breakout above 97.70 could trigger an incline toward the 50-day SMA.
Weakness below 97.70 may see a decline back toward 97.00.
USDInd is forecasted to move 0.3% up or 0.2% down in a 6-hour window after FOMC meeting minutes
Commodity spotlight – gold
Looking at commodities, gold has tumbled over 1% amid the tariff deadline extension.
However, any signs of escalating trade tensions could send investors rushing back towards its safe embrace. If recession fears make a return in the face of higher tariffs, gold prices could shine as the August 1st deadline looms.
Looking at the charts, gold has dipped below $3300 and is trading below the 50-day SMA.
Sustained weakness below $3300 could see a decline toward $3250.
Should $3330 prove reliable support, prices may rebound to the 21-day SMA at $3350 and $3380.
Ready to trade with real money?
Open accountاختر حسابك
ابدأ التداول مع وسيط رائد يمنحك المزيد.