
Daily Market Analysis and Forex News
Week Ahead: Looming “golden cross” teases US30 bulls

US30 ↑ roughly 5% year-to-date, less than 2% away from ATH
Trump tariff drama + US CPI + big bank earnings = volatility?
JPMorgan & Goldman Sachs = almost 14% of US30 weight
US30 forecasted to move ↑ 0.8% or ↓ 1.4% post CPI
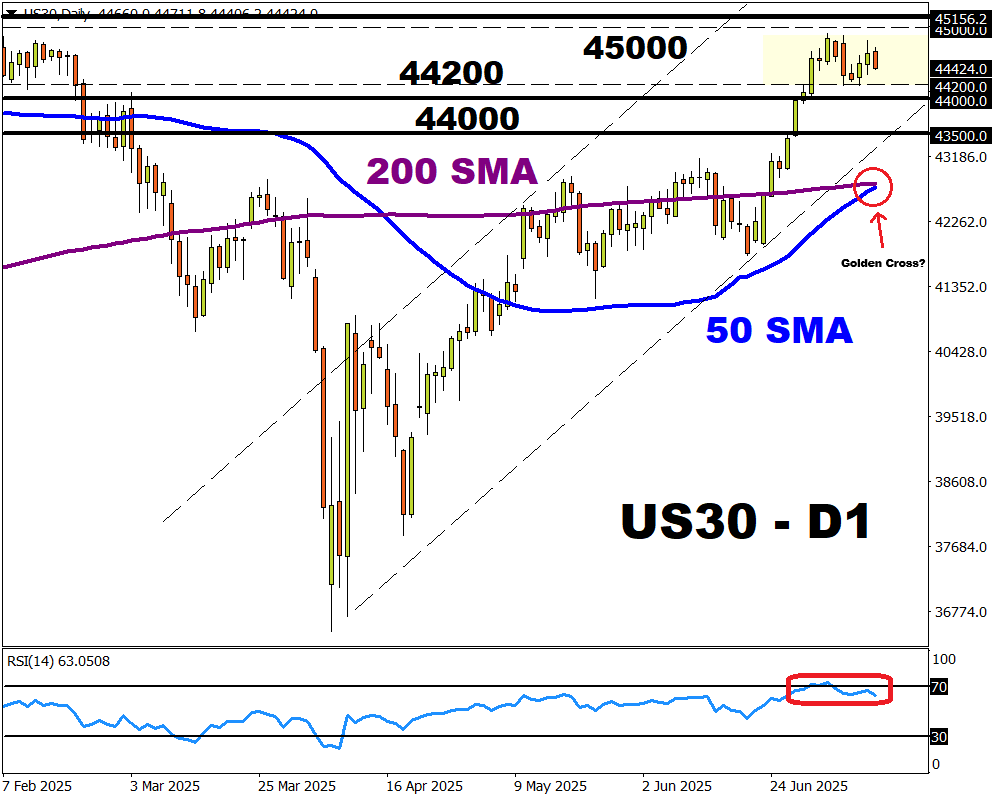
Technical levels: 45000, 44200 & 44000
A flurry of high-risk events may pump FXTM’s US30 with fresh volatility next week.
Prices have been in a range since the start of July amid the ongoing uncertainty around Trump’s tariffs. Just yesterday, Trump threatened Canada with 35% tariffs and 15% to 20% blanket levies on most trading partners.
Note: FXTM’s US30 tracks the benchmark Dow Jones Industrial Average index.
Top-tier data, including the US inflation report and earnings from big US banks, could present new trading opportunities:
Monday, 14th July
- CN50: China trade
- JP225: Japan machinery orders, industrial production
- BITCOIN: Crypto week kicks off
Tuesday, 15th July
- CN50: China GDP, retail sales, industrial production
- AUD: Australia Westpac consumer confidence
- CAD: Canada CPI, housing starts
- GER40: Germany ZEW survey expectations
- GBP: BOE Governor Andrew Bailey speech
- US30: US June CPI, Empire State Manufacturing, JPMorgan Chase earnings, Fed speech
- US500: Wells Fargo, Citigroup earnings
Wednesday, 16th July
- ZAR: South Africa retail sales
- UK100: UK CPI
- US30: US PPI, industrial production, Goldman Sachs earnings, Fed Beige book, Fed speech
- US500: Bank of America, Morgan Stanley earnings
Thursday, 17th July
- AUD: Australia unemployment
- EUR: Eurozone CPI, ECB blackout period
- NZD: New Zealand food prices
- GBP: UK jobless claims, unemployment
- US30: US retail sales, initial jobless claims, Philadelphia Fed factory index, business inventories
- TWN: TSMC earnings
Friday, 18th July
- JPY: Japan CPI
- USDInd: US housing starts, University of Michigan consumer sentiment
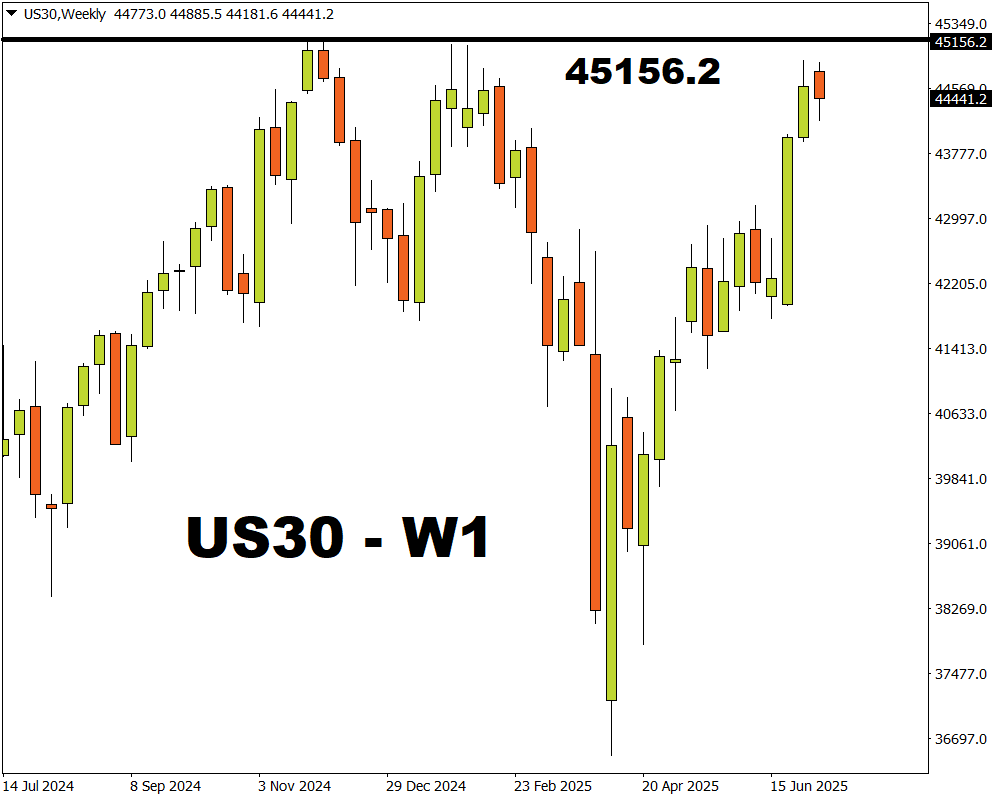
FXTM’s US30 is up roughly 5% year-to-date, with prices trading less than 2% away from the all-time high at 45156.2.
Here are 3 factors that may rock the US30:
1) US bank earnings
Second-quarter earnings season unofficially kicks off on Tuesday 15th July, led by banking giants JPMorgan, Citigroup and Wells Fargo. Goldman Sachs, Bank of America, and Morgan Stanley report their earnings the day after.
US banks are expected to report strong earnings amid relaxed capital requirements, an increase in trading revenues and high interest rates.
It is worth noting that financials make up almost 27% of the US30’s weight with JPMorgan and Goldman Sachs accounting for nearly 14%!
So, the upcoming earnings from US banks are a big deal for the index.
Markets are forecasting a 3.2% move, either Up or Down, for JPMorgan Chase stocks post-earnings
Markets are forecasting a 3.5% move, either Up or Down, for Goldman Sachs stocks post-earnings.
2) US June CPI report - Tuesday 15th July
The incoming US Consumer Price Index (CPI) may impact bets around Fed cuts in the second half of this year.
Markets are forecasting:
- CPI year-on-year (July 2025 vs. July 2024) to rise 2.6% from 2.4% in the prior month.
- Core CPI year-on-year to rise 2.9% from 2.8%.
- CPI month-on-month (July 2025 vs June 2024) to rise 0.3% from 0.1%
- Core CPI month-on-month to rise 0.3% from 0.1% in the prior month
Signs of rising inflation pressures may shave bets around the Fed cutting interest rates.
Note: Speeches from various Fed officials and key US data, including PPI, retail sales, and the Beige Book, may impact the US30 after the CPI report on Tuesday.
US30 is forecast to move 0.8% up or 1.4% down in a 6-hour window after the US CPI report.
3) Technical forces
The US30 remains bullish on the daily charts with a potential “golden cross” pattern in the making.
This is A technical event, when an asset's 50-day simple moving average (SMA) crosses above its 200-day SMA. Such a development is seen as a bullish sign that prices will rise further.
Nevertheless, the Relative Strength Index (RSI) is trading near oversold territory.
Should 44200/44000 prove reliable support regions, prices may rebound back toward 45000 and the all-time high at 45156.
Sustained weakness below 44000 may open a path back toward 43500.
Ready to trade with real money?
Open accountاختر حسابك
ابدأ التداول مع وسيط رائد يمنحك المزيد.