
Daily Market Analysis and Forex News
Bitcoin tests $110k ahead of US CPI data

Bitcoin ↑ over 4% this week, less than 2% away from ATH
“OG” crypto supported by initial trade hopes and ETF inflows
Bitcoin forecasted to move ↑ 3% or ↓ 2.7% post CPI
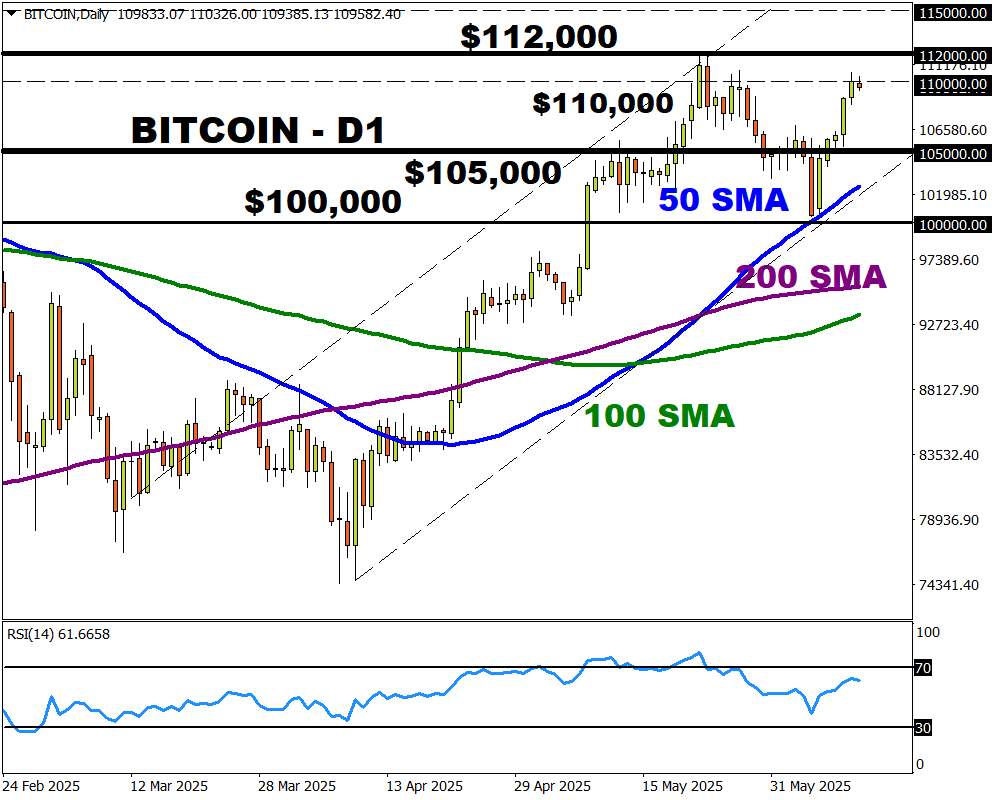
Technical levels: $112,000, $110,000 and $105,000
Bitcoin is up over 4% this week, boosted by the initial optimism over trade talks and fresh ETF inflows.
The “OG” crypto is testing key resistance at $110,000 ahead of the US CPI report this afternoon.
Bitcoin ETFs have seen over $800 million worth of inflows this week, thanks to the improving market mood. However, investors remain somewhat cautious due to the lack of details provided following US-China trade talks in London.
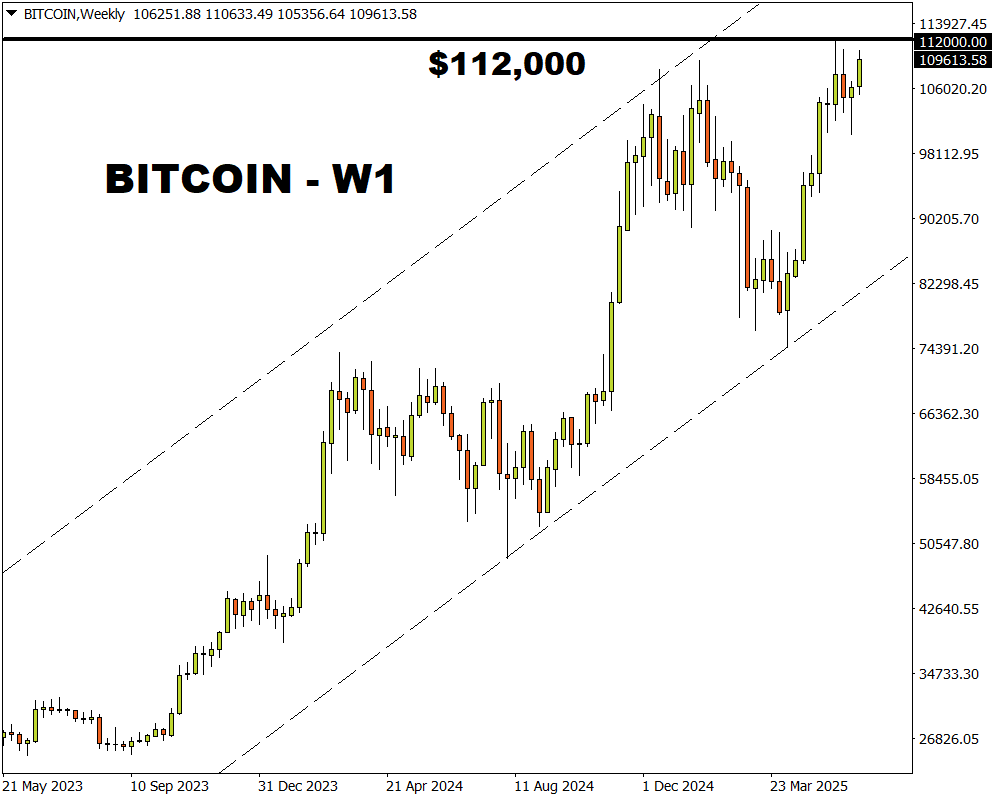
Looking at the charts, Bitcoin remains on breakout watch with prices trading less than 2% away from its all-time high of around $112,000.
On the macro front, it’s all about the US May CPI report which could trigger significant price swings on Bitcoin.
Note: The report will be published at 12:30 PM GMT
Signs of rising inflationary pressures may trim bets around lower US interest rates, weighing on Bitcoin which remains sensitive to rates.
Bitcoin is forecasted to move 3% up or 2.7% down in 6-hour window after US CPI release.
A hotter-than-expected US CPI print may weigh on Bitcoin as Fed cut bets cool.
A softer-than-expected US CPI print could push Bitcoin prices higher, especially if the dollar weakens.
Technical outlook
Bitcoin is firmly bullish on the daily charts with prices 2% away from all-time highs.
BULLISH – A breakout above $110,000 may provide a foundation for bulls to challenge the all-time high above $112,000 and possibly $115,000 – the next psychological level.
BEARISH – Weakness below $110,000 could see prices descend back toward $105,000 and the 50-day SMA at $102,000.
Ready to trade with real money?
Open accountChoose your account
Start trading with a leading broker that gives you more.