
Daily Market Analysis and Forex News
Can Fed rate decision extend US stocks' rebound?

- Fed widely expected to leave US rates unchanged
- Markets fully anticipate next Fed rate cut in July; 1-in-3 chance of June cut
- Hints of earlier-than-expected rate cut could send US stock indices soaring
- Risk assets may pare recent gains if Chair Powell pushes back on rate cuts
- See below for past and projected post-Fed reactions for US500, NAS100, US30
The Fed is set to dominate the market’s attention overnight.
To be clear, the FOMC (Federal Open Market Committee) is widely expected to keep its benchmark rates unchanged at 4.25 – 4.50%.
Given its forward-looking nature, markets are already trying to anticipate the outcomes of FOMC meetings in the months ahead.
Here’s what markets currently predict:
- June: 1-in-3 chance (33.7%)
- July: 25-basis point rate cut fully priced in!
Of course, those odds could drastically change in the days, weeks, and months ahead, not just depending on what the Fed tells us this week.
The chances of a Fed rate cut may also depend heavily on whether US President Donald Trump’s tariffs further weaken US economic growth, forcing the Fed into a sooner-than-expected rate cut.
NOTE: The FOMC lowers interest rates in order to shore up economic growth.
What to look out for today (Wednesday, May 7th)?
Markets will be combing through the:
- FOMC policy statement released at 6:00PM GMT on Wednesday, May 7th, along with …
- Fed Chair Jerome Powell’s press conference (due 30 minutes after the FOMC statement).
Both the FOMC statement and Powell’s spoken words will be scrutinized for clues about the timing of the next Fed rate cut.
Judging by recent commentary, Fed officials appear to be adopting a wait-and-see approach, in assessing the tariffs’ impact on inflation and growth in the world’s largest economy.
After all, recent weeks have shown that tariffs can be announced, and then retracted, seemingly at POTUS’s whims and fancy.
The ongoing narrative is that …
If US tariffs are kept at elevated levels for longer, the greater the potential damage on the US economy.
And given that this week’s FOMC meeting also comes amid the 90-day pause on some of the harshest tariffs, the Fed may be inclined to maintain this wait-and-see approach, without jolting markets in the interim.
Also note that, at this week’s meeting, the Fed will not be releasing a new dot plot (forecasts by each FOMC member on US interest rate levels in the future), nor fresh economic projections.
Hence, any incoming policy signals, if any, are set to stem from the FOMC policy statement and Powell’s press conference.
How might US stock indices react to today’s Fed meeting?
- BULLISH: Should Chair Powell and his FOMC colleagues sound “dovish” and start paving the way for rate cuts, that should cheer on risk assets that sends US stock indices higher.
- BEARISH: If Chair Powell and his FOMC colleagues instead strike a “hawkish” tone, suggesting that US interest rates could stay higher for longer to quell any tariff-induced spikes to US inflation, that could force US stock indices to pare its stunning rebound since early April.
Here’s what markets predict these major US stock indices could react in the 6 hours after today’s FOMC decision:
S&P 500 (tracked by FXTM's US500) could:
- rise by as much as 1.4%
- fall by as much as 1.6
Nasdaq 100 (tracked by FXTM's NAS100) could:
- rise/fall by as much as 1.9%
Dow Jones Industrial Average (tracked by FXTM's US30) could:
- rise as much as 1.1%
- fall by as much as 1.7%
How have US stock indices reacted to recent Fed meetings?
These Fed rate decisions of course hold tremendous sway over markets.
Here’s a sample of the “biggest” reactions by major US stock indices within 6 hours of Fed decisions from the past 12 months:
S&P 500 (US500)
- rose as much as 1.7% (Sept 2024)
- fell as much as 3% (Dec 2024)
Nasdaq 100 (NAS100)
- rose as much as 2.35% (Sept 2024)
- fell as much as 3.5% (Dec 2024)
Dow Jones Industrial Average (US30)
- rose as much as 1.2% (Sept 2024)
- fell as much as 2.7% (Dec 2024)
Over the next 12 months …
Wall Street still predicts double-digit potential gains for US stock indices by this time next year.
Here are the projections for 12-month potential upside for 3 major US stock indices:
- S&P 500 (tracked by FXTM’s US500 index): 16%
(S&P 500 to cross above 6500 by this time next year)
- Nasdaq 100 (tracked by FXTM’s NAS100 index): 18%
(Nasdaq 100 to cross above 23,300 by this time next year)
- Dow Jones Industrial Average (tracked by FXTM’s US30 index): 14%
(Dow to cross above 46,700 by this time next year)
Looking at the price charts …
Widely-followed simple moving averages (SMA) stand in the way of bulls (those hoping prices will go higher) of these stock indexes, and could act as immediate resistance levels post-FOMC meeting:
- 200-day SMA potential immediate resistance for the US500
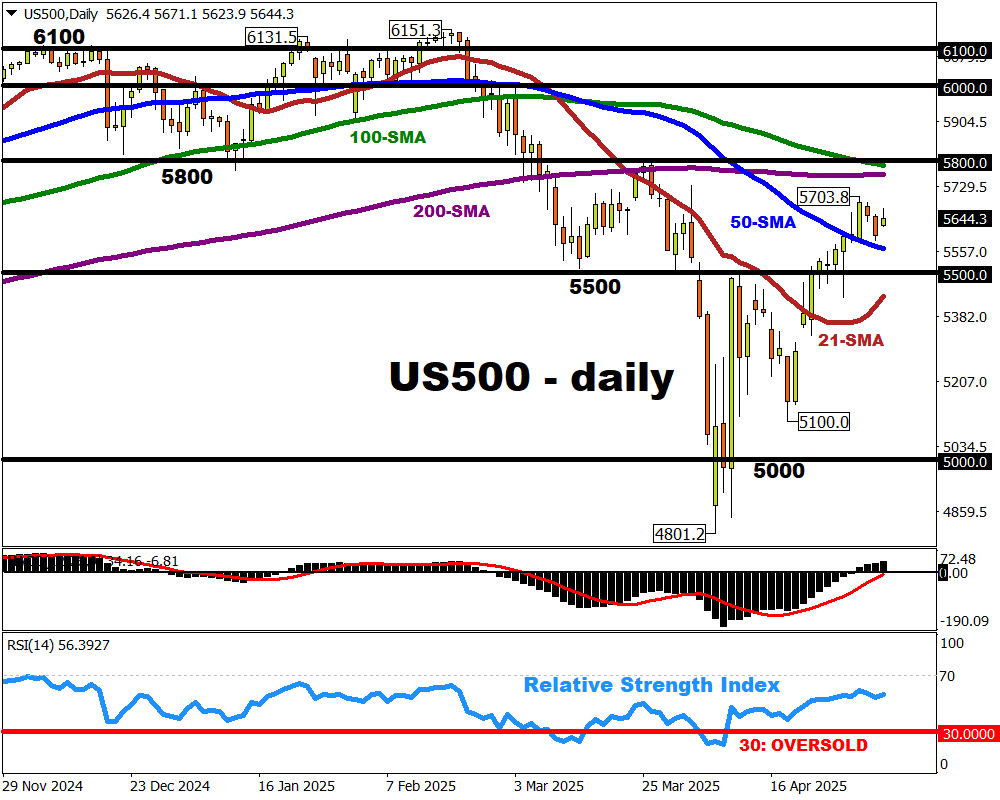
US500: Potential Scenarios
BULLISH: Greater prospects of a mid-year Fed rate cut could send the US500 towards its 200-day SMA / 5700 psychological level. Further north lies its 100-day SMA and 5800 target.
BEARISH: A break below its 50-day SMA could test initial support at the 5,500 round number, with its 21-day SMA and 5400 price region potentially offering stronger support.
200-day SMA potential immediate resistance for the NAS100
Imagen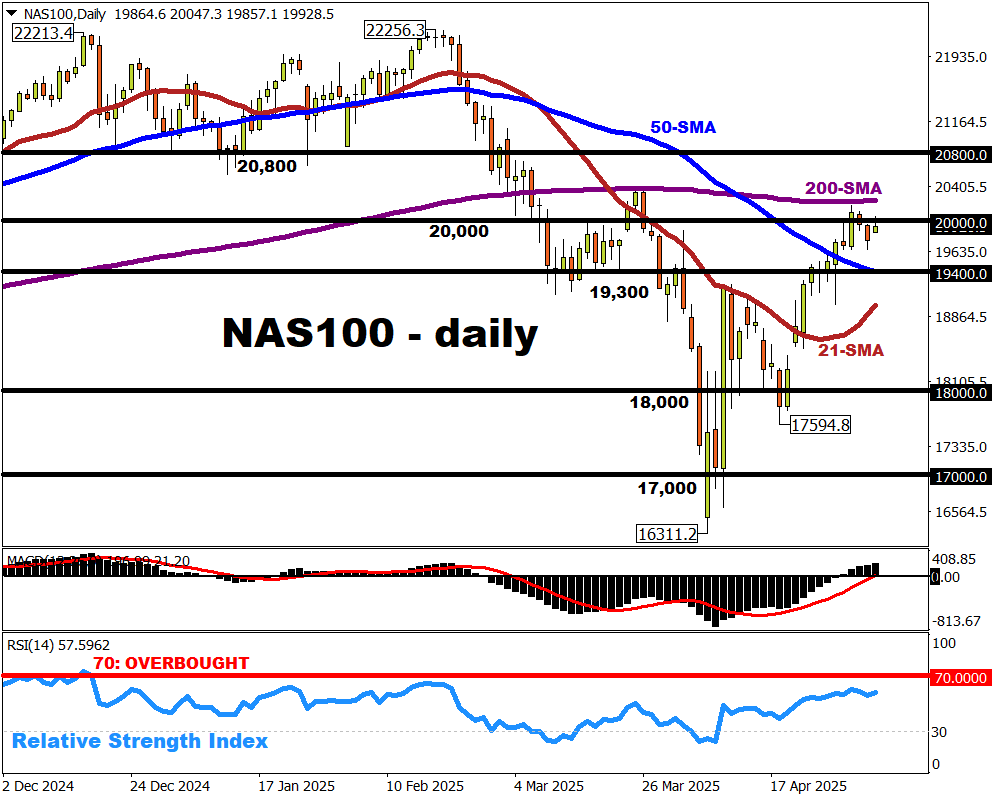
NAS100: Potential Scenarios
BULLISH: A break above the 200-day SMA could see the NAS100 striving for its upside target of 20,800.
BEARISH: The NAS100 may look to find support at its 50-day SMA around the 19,400 region. Further support could arrive around the 21-day SMA.
- 50-day SMA immediate resistance for the US30
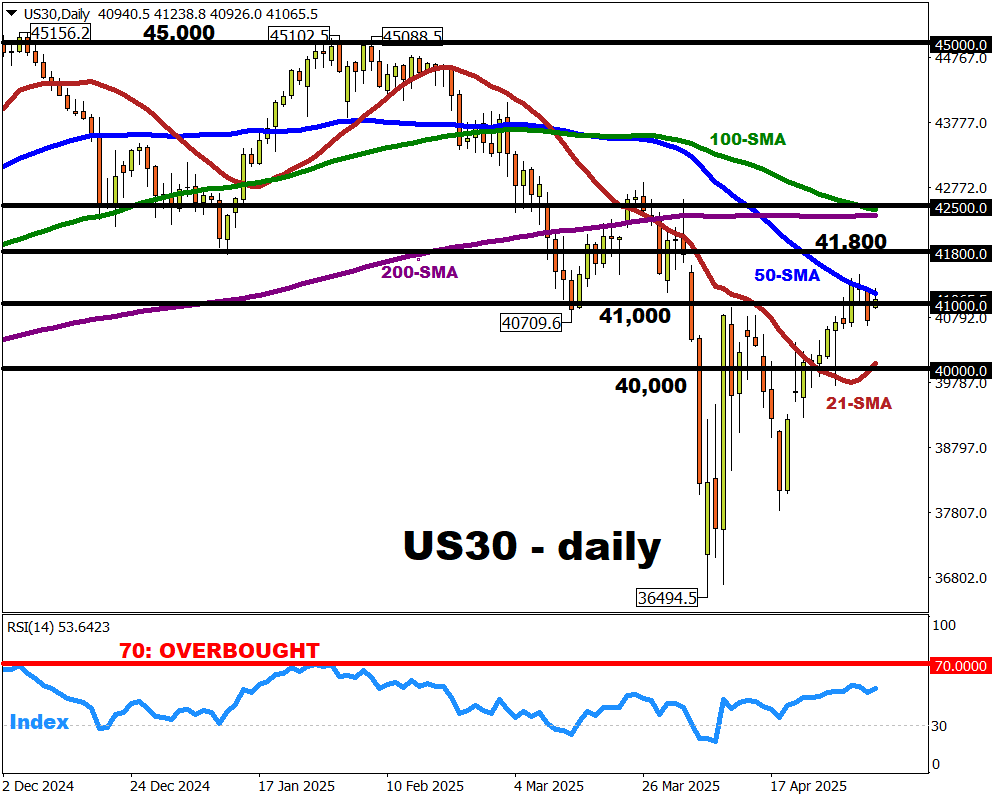
US30: Potential Scenarios
BULLISH: A break above the 50-day SMA could see the US30 striving for its immediate upside target of 41,800. Further north, the price region around its 200-day SMA / 42,500 level / 100-day SMA could lend stronger resistance to bulls.
BEARISH: A second consecutive daily close below the 41k mark for the US30 could see prices faltering to the big, round 40,000 number, where its 21-day SMA also currently lies.
Ready to trade with real money?
Open accountChoose your account
Start trading with a leading broker that gives you more.