
Daily Market Analysis and Forex News
Week Ahead: US500 bulls set to charge 6000?

FXTM’s US500 ↑ 23% from 2025 low
Index has gained over 6% this month, less than 4% away from ATH
Fed Speeches + US data = fresh volatility?
US Global PMIs triggered moves of ↑ 0.8% & ↓ 2.4% over past year
Technical levels: 6000, 5900 & 200-day SMA
FXTM’s US500 has rebounded over 23% from its 2025 low, clawing back into the green for the year!
Prices jumped over 4% this week thanks to the US-China trade truce, a soft US inflation report, and a rally in the tech space.
While bulls seem to be on a roll, a flurry of speeches by Fed officials and US data could impact the index in the week ahead:
Sunday, 18th May
- Atlanta Fed’s annual financial markets conference in Florida
- US500: New York Fed President John Williams speech
Monday, 19th May
- CN50: China property prices, retail sales, industrial production
- EU50: Eurozone CPI
- JP225: Japan tertiary industry index
- US500: Atlanta Fed President Raphael Bostic, Dallas Fed President Lorie Logan and Fed Vice Chair Philip Jefferson speech
Tuesday, 20th May
- AUD: RBA rate decision
- CAD: Canada CPI
- CN50: China loan prime rates
- EUR: Eurozone consumer confidence
- TWN: Taiwan export orders
- US500: Atlanta Fed President Raphael Bostic, San Francisco Fed President Mary Daly and Cleveland Fed President Beth Hammack, St. Louis Fed President Alberto speech
Wednesday, 21st May
- JPY: Japan trade
- NZD: New Zealand trade
- ZAR: South Africa CPI, retail sales
- UK100: UK April CPI
Thursday, 22nd May
- GER40: Germany IFO index, HCOB manufacturing and services PMIs
- EUR: Eurozone HCOB manufacturing and services PMIs, ECB minutes
- JPY: Japan machine tool orders, au Jibun Bank manufacturing and services PMI
- TWN: Taiwan jobless rate
- GBP: UK S&P Global manufacturing and services PMIs, GfK Consumer Confidence
- US500: US S&P Global manufacturing and services PMIs, jobless claims, existing home sales, New York Fed President John Williams
Friday, 23rd May
- GER40: Germany GDP
- CAD: Canada retail sales
- SG20: Singapore CPI
- UK100: Retail sales
- JPY: Japan CPI
- TWN: Taiwan industrial production
The US500 index is up over 6% this month, trading less than 4% from its all-time high.
Note: US500 tracks the benchmark S&P 500 index
Could the index return to all-time highs with technical and fundamental factors favouring bulls?
Here are 3 factors to watch out for:
1) Atlanta Fed’s Annual Financial Markets Conference
The Federal Reserve Bank of Atlanta’s financial market conference is scheduled for May 18 – 21.
Speeches from up to seven different Fed officials will be closely watched for clues on the Fed’s next policy move.
In Powell’s latest speech, he warned that inflation could be volatile in the years ahead thanks to supply shocks. He has struck a hawkish note in recent months, stating that the central bank will adopt a “wait and see” approach on rates.
Traders are currently pricing in a 40% chance of a Fed cut by July with a move fully priced in by September.
Should Fed officials strike a hawkish note and express concerns around inflation, this may weigh on the US500 as Fed cut bets cool further.
If Fed officials sound dovish and signal that the Fed could be cutting rates sooner than expected, the US500 may extend gains.
2) US Global PMIs + Jobless claims data
A mini-data dump on Thursday could provide fresh insight into the health of the US economy.
Investors will direct their attention toward the latest US global PMIs and jobless claims figures , which may influence Fed expectations.
Over the past 12 months, the US global PMIs have triggered upside moves of as much as 0.8% or declines of 2.4% in a 6-hour window post-release.
Over the past 12 months, the initial jobless claims have triggered upside moves of as much as 1.6% or declines of 2.0% in a 6-hour window post-release.
Should overall data support the case for lower US rates, the US500 may venture higher.
If the data impacts bets around lower Fed cuts, this may weigh on the US500 index.
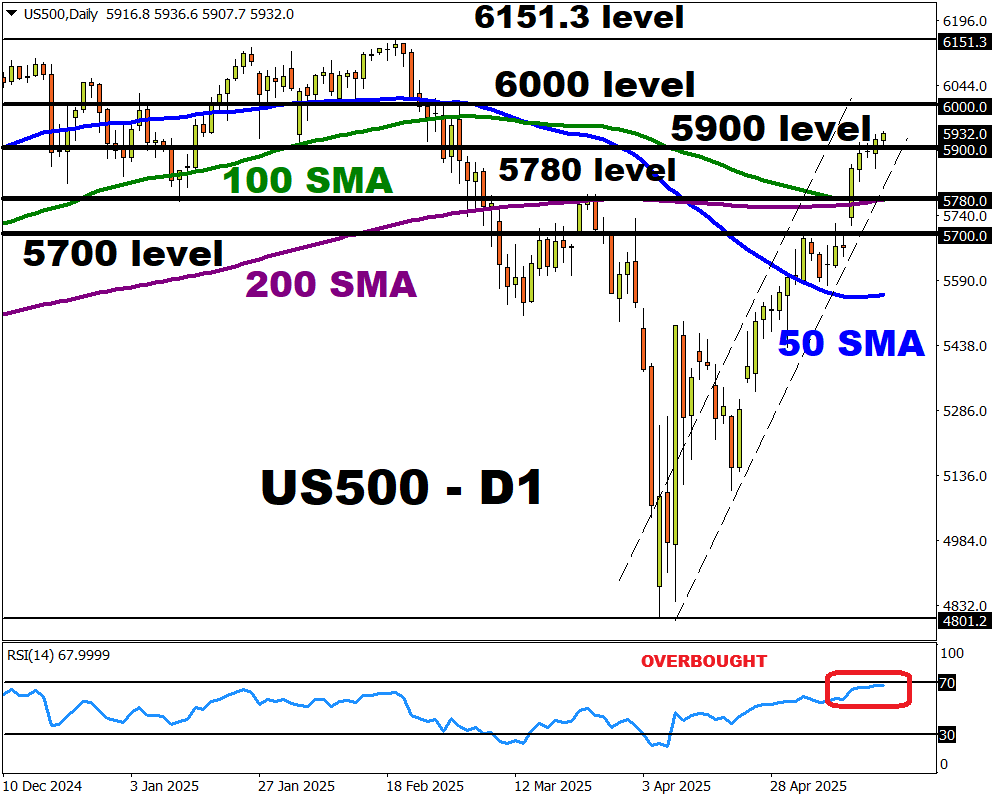
3) Technical forces
The US500 is firmly bullish on the daily timeframe with prices trading above the 50, 100, and 200-day SMA. However, the Relative Strength Index (RSI) signals that prices are heavily overbought.
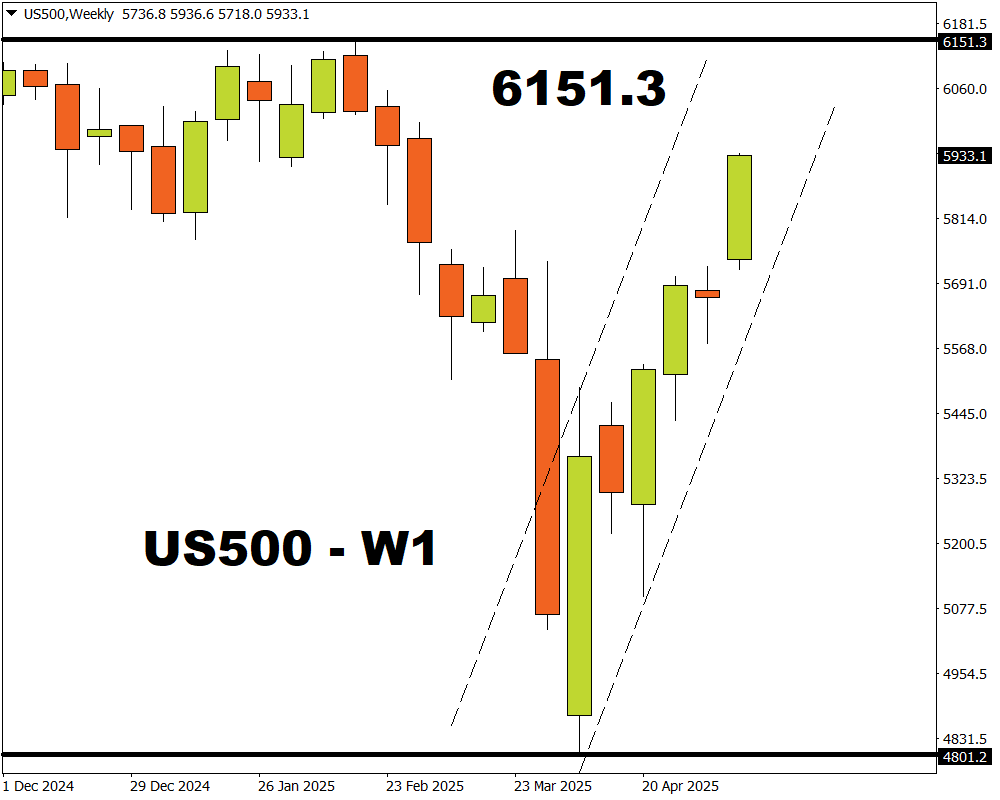
A solid weekly close above the 5900 level may open the doors back toward 6000 and the all-time high at 6151.3.
If prices slip back below 5900, this may trigger a selloff toward the 200-day SMA at 5780 and 5700.
Ready to trade with real money?
Open accountChoose your account
Start trading with a leading broker that gives you more.